

ELF - executable linkable file
An Introduction to Linux executable binaries

.noise
howdy_amigos,
In this post I want to dig into the ELF file format. In case you never heard of this - it's the format for executable files, or binaries, on Linux. Binaries contain operational codes, metadata and memory sections, combined into a well-defined structure - the executable linkable file format. Beside it's famous usage on Linux, this format is used on a variety of other platforms, such as:
Unix, Solaris, Bsd, BEOS
Android
Playstation portable, Playstation 2-4,
Dreamcast, Gamecube, Nintendo Wii
Steam Deck
Operating systems from Nokia, Samsung and Ericson
Microcontrollers from ATmel and Texas Instruments
This means we can compile the same source code for each platform, with the same compiler, and the binary produced will always look the same as long as the platform is the same (32/64 bit). Of course the platforms themself have different specifics, like Steam Deck vs. Microcontrollers from ATmel, so there is a bit more to it than that ..
Interestingly, there is also a format called DWARF ( Debugging With Arbitrary Record Format ) - some of the tools introduced will use this format, but I won't go into it's specifics, I just thought I'd share this funny detail.
This time I got something relaxing for you, because everybody is overwhelmed from time to time and needs something to zone out, so take care of yourself.
The compilation process
For starters, we should take a moment and think about how a binary is made in the first place. If you ever programmed something, you will have heard the term compiler. Usually, most programmers won't distinguish between compilers or even their target platform, and oversimplify it to [ the compilation process ].
However, there are multiple compilers that will produce different binaries, even for the same language and source code, like Microsoft's MSVC compiler and gcc. Although C++ compilers, their target platform requires them to build different executables, since Microsoft uses their own executable format, called PE - the Portable Executable format, and gcc is mostly used on Unix-style operating systems.
Java's javac compiler will produce an intermediate code that you can think of as pseudo-assembly. The Java virtual machine will then interpret this code and produce JIT-code (Just-In-Time compiled code blocks), which allows Java to famously "run on any device". The reality, however, is that java produces code that runs on any Java virtual machine and then simply translates this to the target system's format, like x86.
tl;dr
Let's assume C++ code and look at the compilation process in more detail:
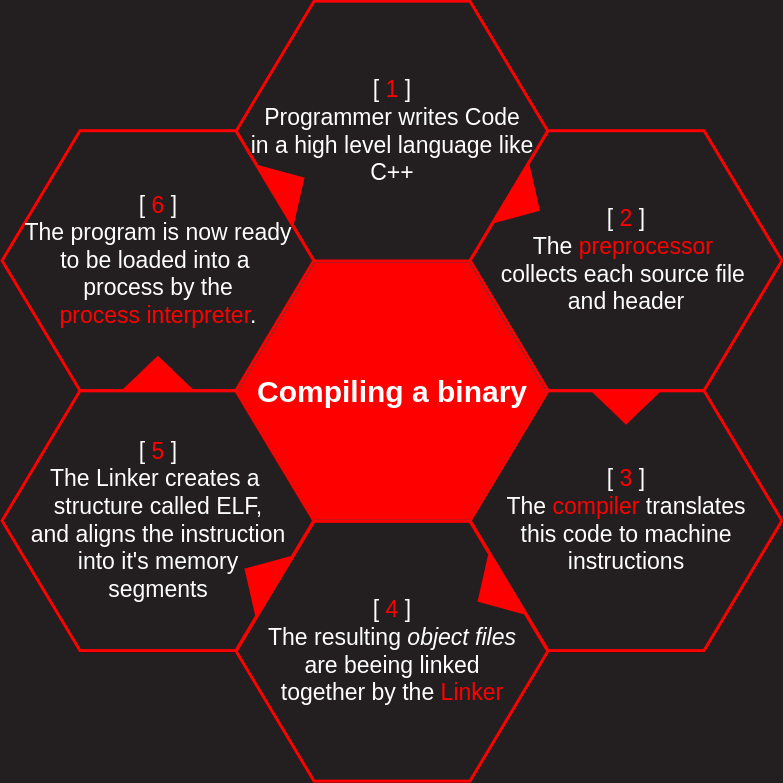
As you can see in the picture, the compilation process is handled by multiple tools working together. Some noteworthy additions to this process:
The preprocessor will expand each header file into a single file, and will also expand each macro at this point (#include and #define in case of C++). This process can be followed by using g++ -E -P
The compiler produces assembly code for the given platform, the used programming language does not matter
The assembler then generates object files from this code, with one source file resulting in one object file. To actually save and view these files, use g++ -c filename.cpp
Object files are relocatable, meaning their final place in memory is not yet defined. This also means they will still carry relocation symbols, simply names left from the compilation process, as targets, instead of memory locations.
The linker now places each object file into a single executable file, and resolves all relocation symbols, replacing the symbols with the actual memory addresses. It also reserves memory, creates sections with section-headers and builds a basic frame for it's [ target process ]. To be specific, the linker works together with the process-interpreter for this.
Binary structure
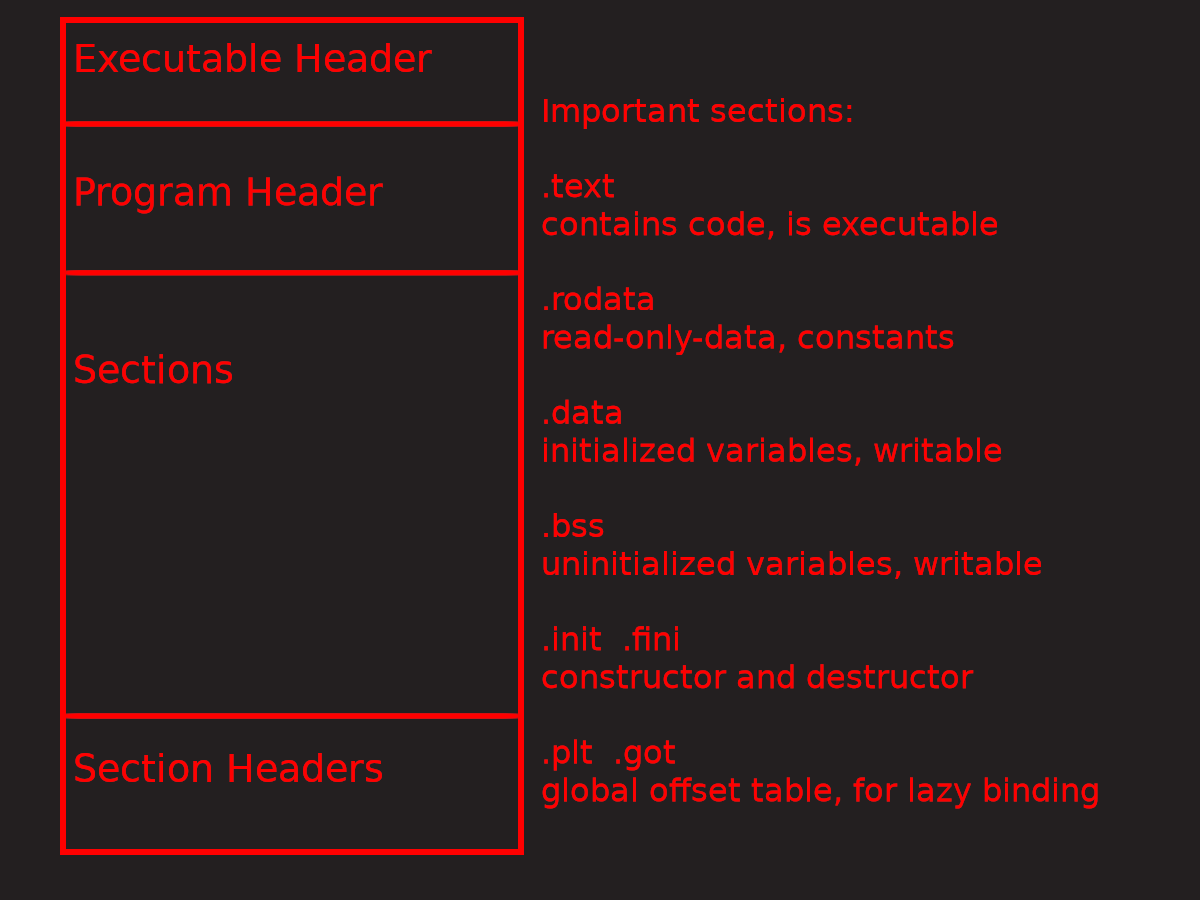
Next, we should probably look at how a binary is executed. Let's start with a diagram of how a binary is structured:
We are going to talk about some of these contents in a second, but first let's write up a simple test program for demonstration purposes:
#include <iostream>

using namespace std;

int someVal = {0x7fU};

int main()
{
    fprintf(stdout, "The number: 0x%x\n", someVal);
    fprintf(stdout, "The number: %d\n", someVal);
    fprintf(stdout, "The number: ");
    for (int i = sizeof(someVal) * 2-1; i >= 0; i--) {
        fprintf(stdout, "%d", (someVal >> i) & 1);
    }
    fprintf(stdout, "\n");
    return 0;
}
The actual content of the program doesn't matter to us, we will rather use it to inspect the binary it produces after [ the compilation process ]. Note that I compiled two identical versions of this program, called sectionPIE and sectionDemo. For the purpose of this article, consider them to be completely identical. I used them to test around with PIE (Position Independent Executable) compilation, so don't get confused about the names of the binaries in the screenshots. We will talk a bit about PIE executables at the end of this article.
The ELF header
Every ELF binary has an executable header. This header has various fields in it which are needed to load it into a process, like the [ entry point address ], the [ start address of the sections and headers ] and the [ architecture ], to name a few.
Also, every ELF file starts with 7f 45 4c 46 , translating roughly to 7 E L F - or seven-eleven, an old idiom. You can view this header under /usr/include/elf.h on every Linux machine, here is a snippet from it:
/* The ELF file header.  This appears at the start of every ELF file.  */

typedef struct
{
  unsigned char e_ident[EI_NIDENT];     /* Magic number and other info */
  Elf64_Half    e_type;                 /* Object file type */
  Elf64_Half    e_machine;              /* Architecture */
  Elf64_Word    e_version;              /* Object file version */
  Elf64_Addr    e_entry;                /* Entry point virtual address */
  Elf64_Off     e_phoff;                /* Program header table file offset */
  Elf64_Off     e_shoff;                /* Section header table file offset */
  Elf64_Word    e_flags;                /* Processor-specific flags */
  Elf64_Half    e_ehsize;               /* ELF header size in bytes */
  Elf64_Half    e_phentsize;            /* Program header table entry size */
  Elf64_Half    e_phnum;                /* Program header table entry count */
  Elf64_Half    e_shentsize;            /* Section header table entry size */
  Elf64_Half    e_shnum;                /* Section header table entry count */
  Elf64_Half    e_shstrndx;             /* Section header string table index */
} Elf64_Ehdr;
I shortened it a bit, but you can see the name and description of every field here, and you can also see that this is for 64 bit architecture ( hence the ELF64_ prefix ). The file also has descriptions for 32 bit, which can run without problems in every 64 bit Linux system. We can see the size of every field, f.e. ELF64_Word would tell us that 16 bit were reserved for this field. We can use a program called readelf to get a nicely formatted output of the real in-binary ELF header:
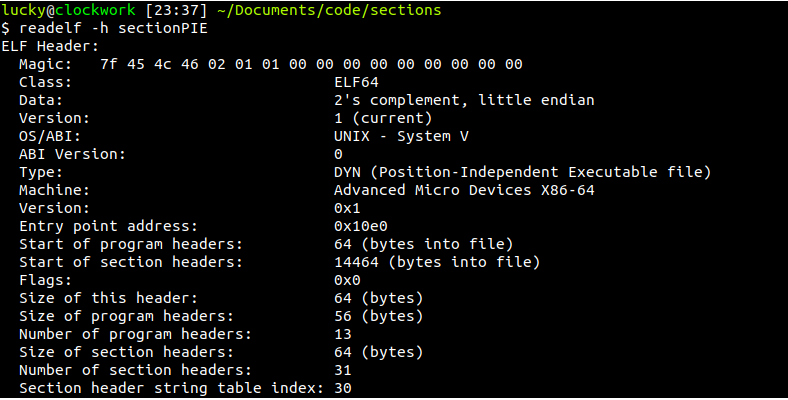
Talking about each and every field here would be pointless, but I would urge you to go and try implementing an ELF-file-reader, and the logical start would of course be to scan the ELF-header and move along from there. If you read the header-fields, it is not hard to automatically find the program-headers from there. You can also jump to the entry point and begin looking at the source code with ease from here.
Here is an image of a very similar program i wrote for Microsoft Windows:
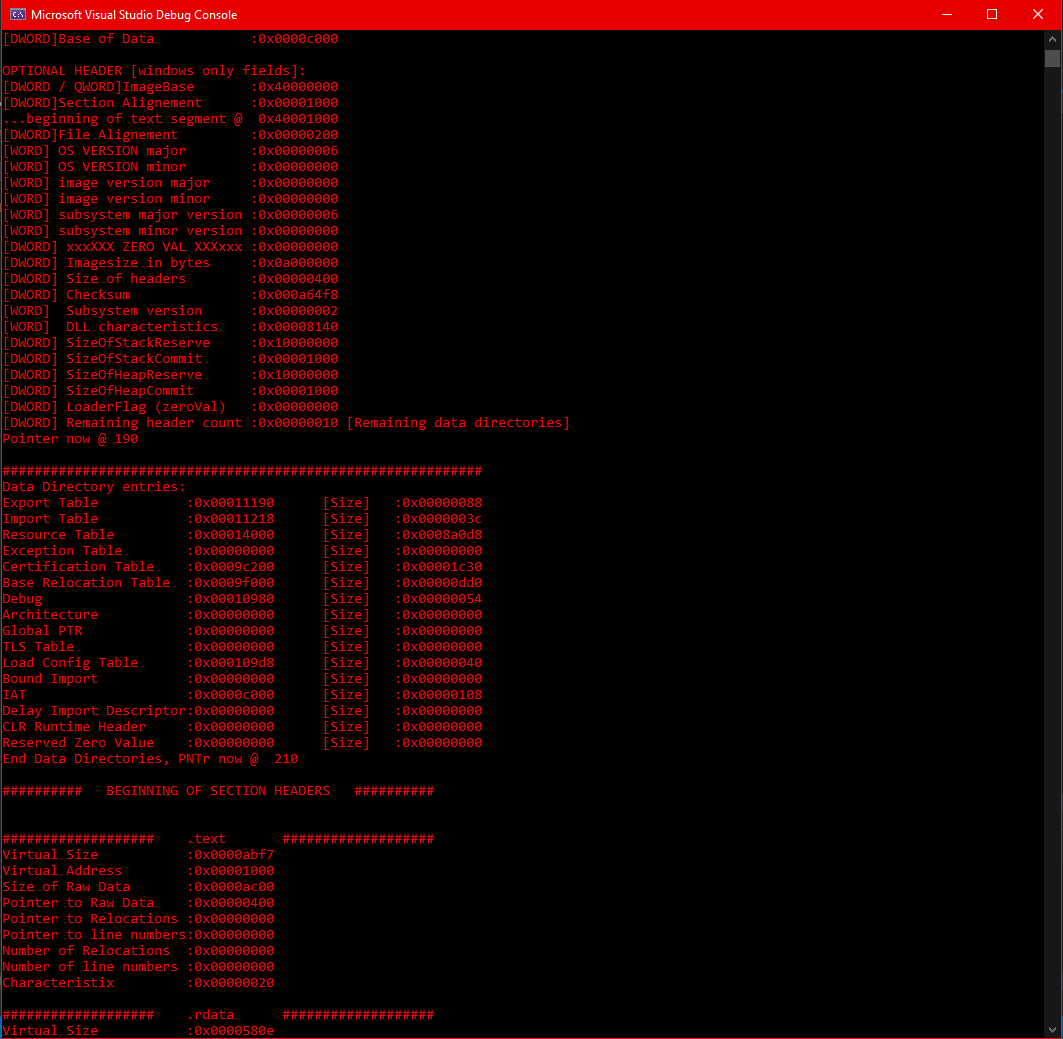
The difference here is that PE, or Portable Executable, is the binary format Microsoft Windows uses, so names and memory layout differ, but it is similar enough to showcase it here.
Sections and Segments
The sections are chunks of memory designated for various things, some only available in a debug build, others have no purpose at all during run-time and are only used for the linker. I already mentioned the most important ones in the picture further above, and it's not necessary to know the specifics of each- and every-one. Information about these sections, like their offset in the file, are stored in the section header table at the bottom of the binary, which serves as a kind of roadmap into the binary and contains valuable meta-information. We can use readelf again here to list all sections in our test binary:
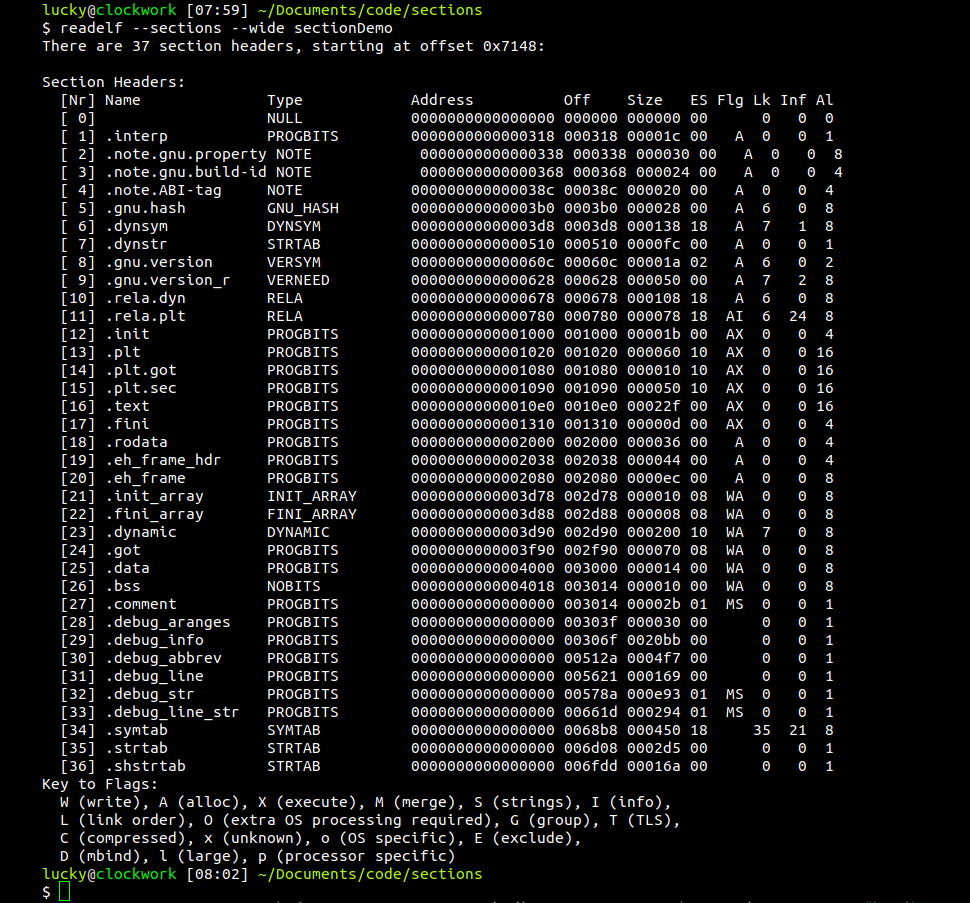
We can see there are quiet a number of sections, many without an actual address. They are either unused, like debug sections, or are important when the program is loaded into memory, not when it's stored on the hard drive. We can also see the flags set on these sections, with the most important ones being W (Write), A (Allocate) and X (Xecute).
But wait, we know about [ sections ], but what are [ segments ]?
Sections are only existent until link-time, when the OS ( or rather the linker ) loads the binary into a process. After that, sections are compressed into segments, chunks of raw data, and it is much harder to read and interpret them. The binary is projected into a process, and information about these segments can be found in the Program header table.
Of course, we can also look at the segments the linker will create:
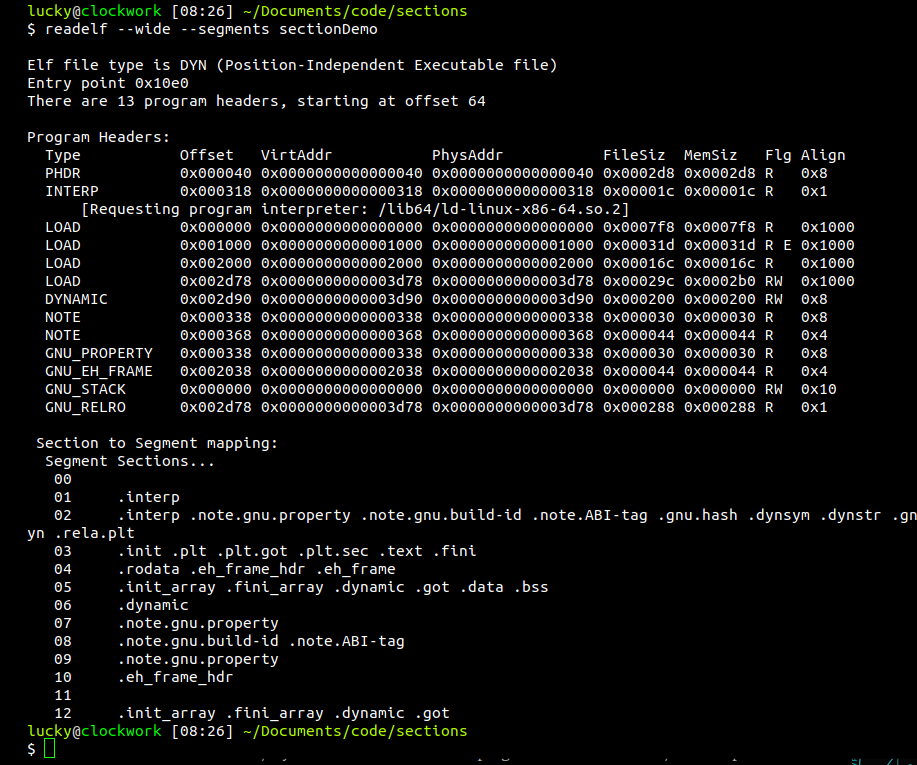
We find that sections will be compressed into segments based on their flags, f.e. segment 03 contains only sections that are flagged [ allocatable ] and [ executable ].
In the final [ process] that is executed, we can find no evidence of any of this, usually a running process looks like this:
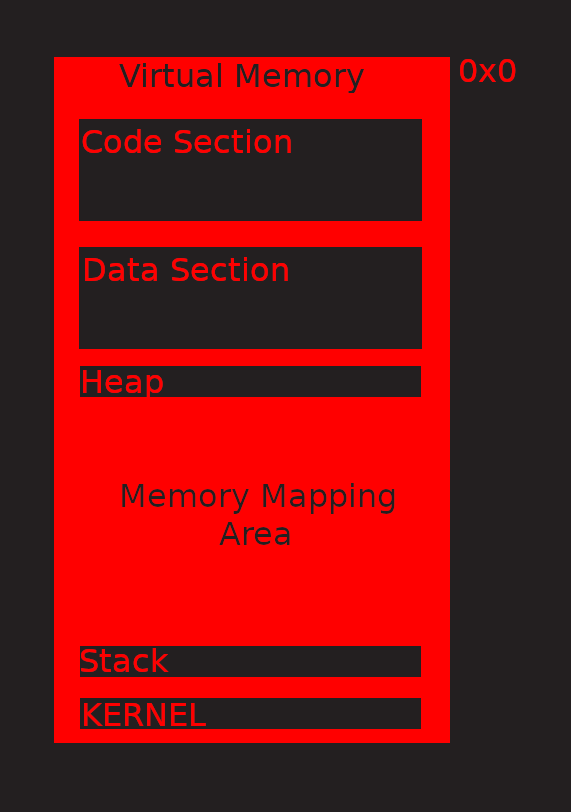
To create a [ process ] from our [ program ], the linker has to reallocate symbols, meaning it has to resolve all symbolic names used during programming and compiling, and replace them with their real in-memory address. It will also reserve heap memory for all libraries and objects and build up a stack. It builds up the first stack frame with the program arguments, then passes control to the very first function in the program, called main_start. ( ofc it's not main )
You may have heard of the stack growing towards lower addresses, while the heap's growing in the other direction. In the picture, imagine both expanding into the memory mapping area. I always had problems imagining that, so here's a nice analogy: The stack is like a tower. With every function call, we put another floor on top of it, a stack-frame. Needless to say, should the stack ever grow into the heap space, you're gonna have a bad time.
Inspecting a binary
Let's take a moment to actually look inside an ELF file now. There are a lot of professional tools for disassembling and debugging, like GHidra or RedAsm, and I recommend you to learn at least one of them, but I want to keep it simple here and just use gdb ( gnu debugger ), readelf and objdump.
Readelf
Readelf will show us all sections- and segment-mappings, with their memory location and size. We already did this in the last chapter, so I won't show it again here. It is a really useful and easy-to-use program, so looking at it's man-page and figuring out what it can do would be a good first step if you want to get deeper into binary analysis.
Note that the program will not serve as a disassembler, so while you'd be able to get many meta-information with it, to actually look at the code you'd have to use a hex-editor, a cumbersome and ineffective way of looking at binaries. But this is where our next program comes into play:
Objdump
This program is much better than every hex-editor, because it can dump code and memory in a easy to read manner, and even tries to predict jump targets and memory addresses wherever this is possible. I say wherever possible, because objdump performs what is generally known as static analysis. This means the binary is analyzed in it's on-disc-form, which can make finding memory addresses and function boundaries impossible at times, but is a good starting point.
Let's use objdump to inspect two sections called .plt and .got:
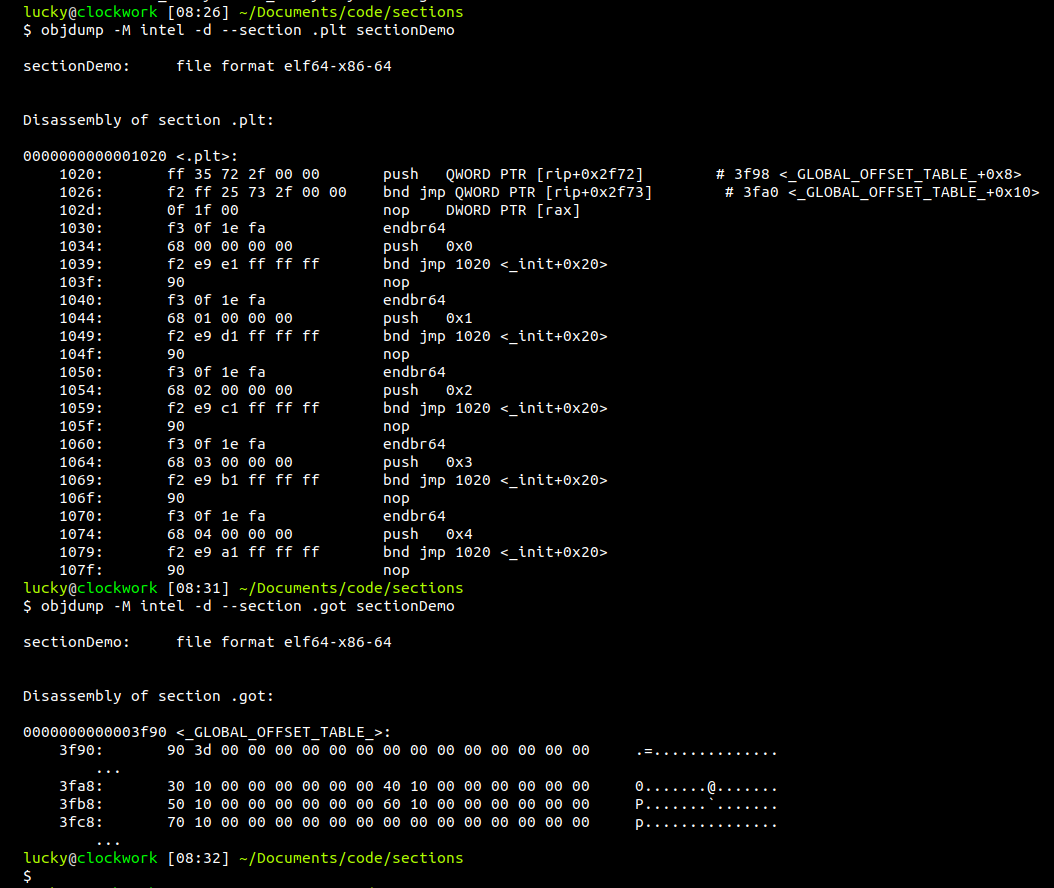
Objdump will first print out the memory addresses of the hex values it shows in the center. Take a moment to actually follow these addresses. Notice how there are repeating patterns in the memory mapping? In the .plt section, there are several stubs that are exactly 16 byte long, ranging for example from 0x1040 up to 0x104f. The 0x90 at the end of each block is a nop, no-operation, which is basically noise that does not serve a real purpose in the program, but it aligns the code in a way that each stub starts at a memory address evenly dividable by 16. Alignments like that are important, some architectures even hardware-enforce them.
Next up, we can find the opcodes, operational codes that are hardwired to our CPU. Each opcode translates to a specific operation, f.e. the aforementioned nop has opcode 0x90 and is encoded in a single byte. Other opcodes feature operands, like the very first operation, [ push QWORD PTR [rip+0x2f72] ]. Imagine the operands as kind of arguments passed to the operation, in this case having a combined size of 6 bytes. At location 102d we can see a nop with operands, but this time the nop has opcode 0f and is 3 byte long. It is once again used to align the block of memory in a way that the next block can start at 1030, which is evenly dividable by 16.
The part on the right is the translation of these opcodes into MNEMONICS. The name is really stupid name actually means donkey-bridge in my native tongue. This is essentially a human-readable form for operations, and what is known ass assembly in general. Objdump even did us the favor of resolving the pointer addresses in the first two lines into a readable address, revealing them to point to the .got section. This and more is what professional disassemblers can do for you, but it's not always possible in a static way, as you already know.
You might wonder why the .plt section is printed out in such a nicely manner, while the .got section is this ugly blob of memory. To understand this, we have to resort to our readelf output from before:
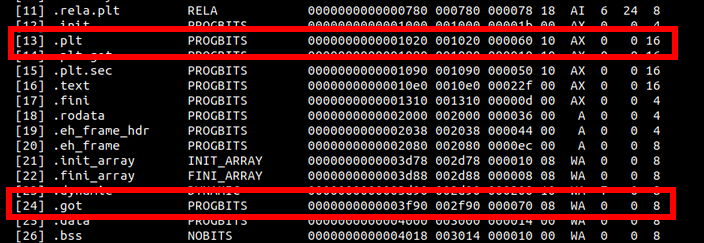
We can see here that the .plt section has an executable flag set, meaning it contains runnable code, while the .got section is not executable. Unsurprisingly, it is rather pointless to dump memory that is not executable in the same manner as executable operations, so objdump only printed out the raw memory for us, which is useful when looking at string-tables.
Let's take a moment to talk about endianess now. Go back and pay close attention to the first line objdump printed out for the .plt section. Notice how the values in operands don't match the in-memory bytes?
In-memory values read [ ff 35 72 2f 00 00 ], but here objdump somehow translated this to [ push QWORD PTR [rip+0x2f72] ]. The first bytes represent the operation and stay the same, but why the hell is the 0x2f72 part, the operand, backwards-encoded in memory?
When you place literals into an operand, like 0x2f72, it will end up as 72 2f in the actual binary. This really confusing fact is due to the endianess of x86 binaries, called little endian ( guess how the other one is called ).
When reading in the operation, an internal stack is build up to match every operand. By placing the bytes in the binary "backwards", they are in the correct order for the CPU when executing the operation, meaning 72 is the topmost value.
The last bytes, 00 00, just expand the operand to 4 bytes due to specifications, and are not explicitly printed by objdump in this case.
GDB - the Gnu Debugger
We can't be seriously talking about binary analysis without mentioning gdb, the gnu debugger. This topic is probably better suited for it's own article, so I won't go into the depths of debugging here. However, the principles of debugging are really important for binary analysts, so it is something you should always be practicing. I was kind of shocked when I realized how many programmers, people who should know how to debug, fail gloriously at this task and try dumping memory by printing it to the console as their favorite means of debugging code.
In the article featuring gdb, we will probably debug a simple program where we prompt the user to input a number to access something in an array, or loop over it, but failed to realize how arrays start at field [ 0 ], not [ 1 ], which is one of the most common programming mistakes for beginners.
Of course, using a dedicated tool for reverse engineering, like GHidra, will help you with many things gdb just can't offer, like a GUI, and can boost your productivity to the next level. But for beginners, I highly recommend learning how to operate gdb to get a fundamental understanding of [ the debugging process ]. In fact, many IDEs like VSCode only provide a graphical wrapper around the gdb interface when debugging C++ code, helping you at watching things like registers and the stack, but ultimately use gdb for running through the program. Professional tools take it a step further and allow for creating visual "maps" through the process, live-patching, scripting and, in general, dynamic analysis ( during runtime ).
Position independent executable
At first, I wanted to showcase lazy-binding at this point, a technique where function calls to external libraries are resolved the moment the call takes place. This was introduced to boost performance during startup, and also optimized program flow since we only need to resolve addresses if we call them at all. A call to some error-logging functions wouldn't be needed if no error ever came up during execution, after all.
There are also some hacking techniques where you capture the calls to these external libraries, which invoke so-called stubs, and reroute them to wherever you like before the function is called for the first time. Preventing security flaws is more important than ever nowadays, and is probably one of the reasons .got relocations just aren't that important anymore on modern Linux architectures.
With the uprising of PIE binaries, Position Independent Executables, a decision was made to resolve all symbols during linking. We don't really lack the computing power now, so optimizing for speed is not that important when CPUs perform operations at nanosecond timings, thus compilers will prefer security over speed, which makes sense if you think about it. Position-independent code can be executed at any memory address without modification. This differs from absolute code, which must be loaded at a specific location to function correctly, and load-time locatable (LTL) code, in which a linker or program loader modifies a program before execution, so it can be run only from a particular memory location.
If you want to know whether your binary features PIE relocations, you can use
readelf -a <targetBinary> | grep BIN
If the binary has PIE enabled, you will see this output:
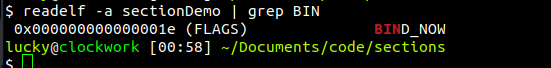
The BIND_NOW flag basically makes .got relocations obsolete. You can disable this behavior by compiling your program with the -no-pie argument, but since this is the de-facto standard nowadays, I will leave it at that.
But what even is a position independent executable? To understand this, we must look at our program before and during execution. Let's use gdb to inspect a binary before it's execution ( meaning we only loaded it into gdb with file <name> ):
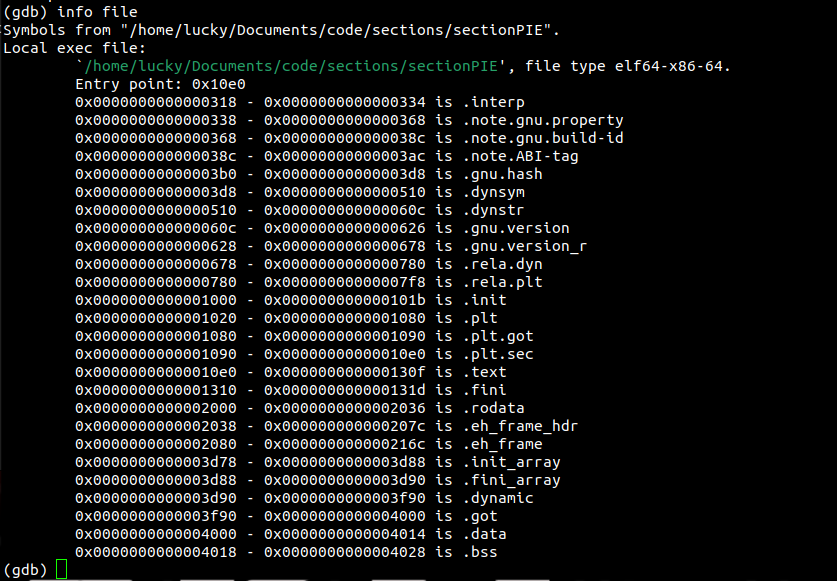
Gdb shows us which memory ranges our sections use after being compressed into segments. Notice that each address is relatively low, the highest starting at 0x4018.
When PIE relocations take place, these sections are moved around in the process' address space randomly, so an attacker could not simply use this table to jump around in memory. The specifics are not important here, just know the sections get moved around while still required to follow alignment and pagination rules of the architecture. We can confirm this by looking at this table during program execution:
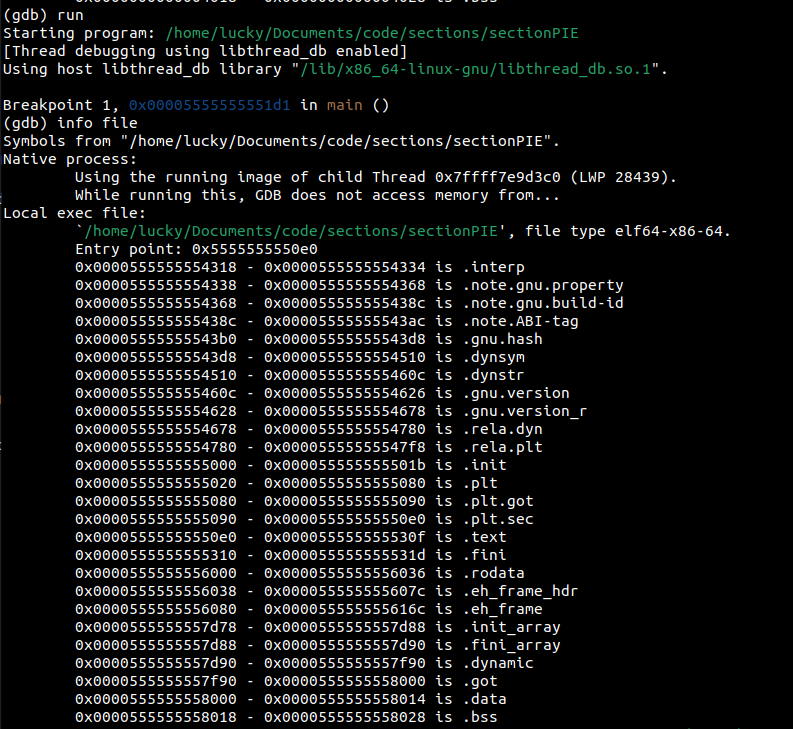
We can see that the sections locations got filled up by big chunks of bytes, placing them at completely different locations in the address space of our process. This is calculated during run-time, so you can't just look into a binary and expect the sections to translate to the same addresses in the running process. Will this help prevent cracking and exploiting binaries? Probably not, but it makes many automated tools unreliable, especially older ones.
Note there are differences in how different architectures implement this feature, and I can only speak for x86 ELF architectures here. I am no expert in PIE code per se, so I can only link to Wikipedia for further investigation here, but as long as you get the principle, you can dig into it.
This was certainly a long article, thank you for sticking with me till the end. If this topic sparked your interest, make sure to also read the follow up article about gdb which I will surely soon publish (⋟﹏⋞)


